Atradius Atrium
Get direct access to your policy information, credit limit application tools and insights.

 United Kingdom
 Australia
 Austria
 Belgium
 Brazil
 Bulgaria
 Canada
 China
China
 Czech Republic
 Denmark
 Finland
 France
 Germany
 Greece
 Hong Kong SAR
 Hungary
 India
India
 Ireland
 Italy
Italy
 Japan
Japan
 Lithuania
 Mexico
 Netherlands
 New Zealand
 Norway
 Poland
 Portugal
 Romania
 Singapore
 Slovakia
 Slovenia
 Spain
Spain
 Sweden
 Switzerland
 Turkey
 United Arab Emirates
United Kingdom
United Arab Emirates
United Kingdom
 United States

Ten years after the Brexit referendum, the economic verdict is finally clear. Leaving the EU has slowed UK trade, reduced the size of the economy and ultimately made life harder for many british businesses, which now face a new reality of trading in the slow lane.
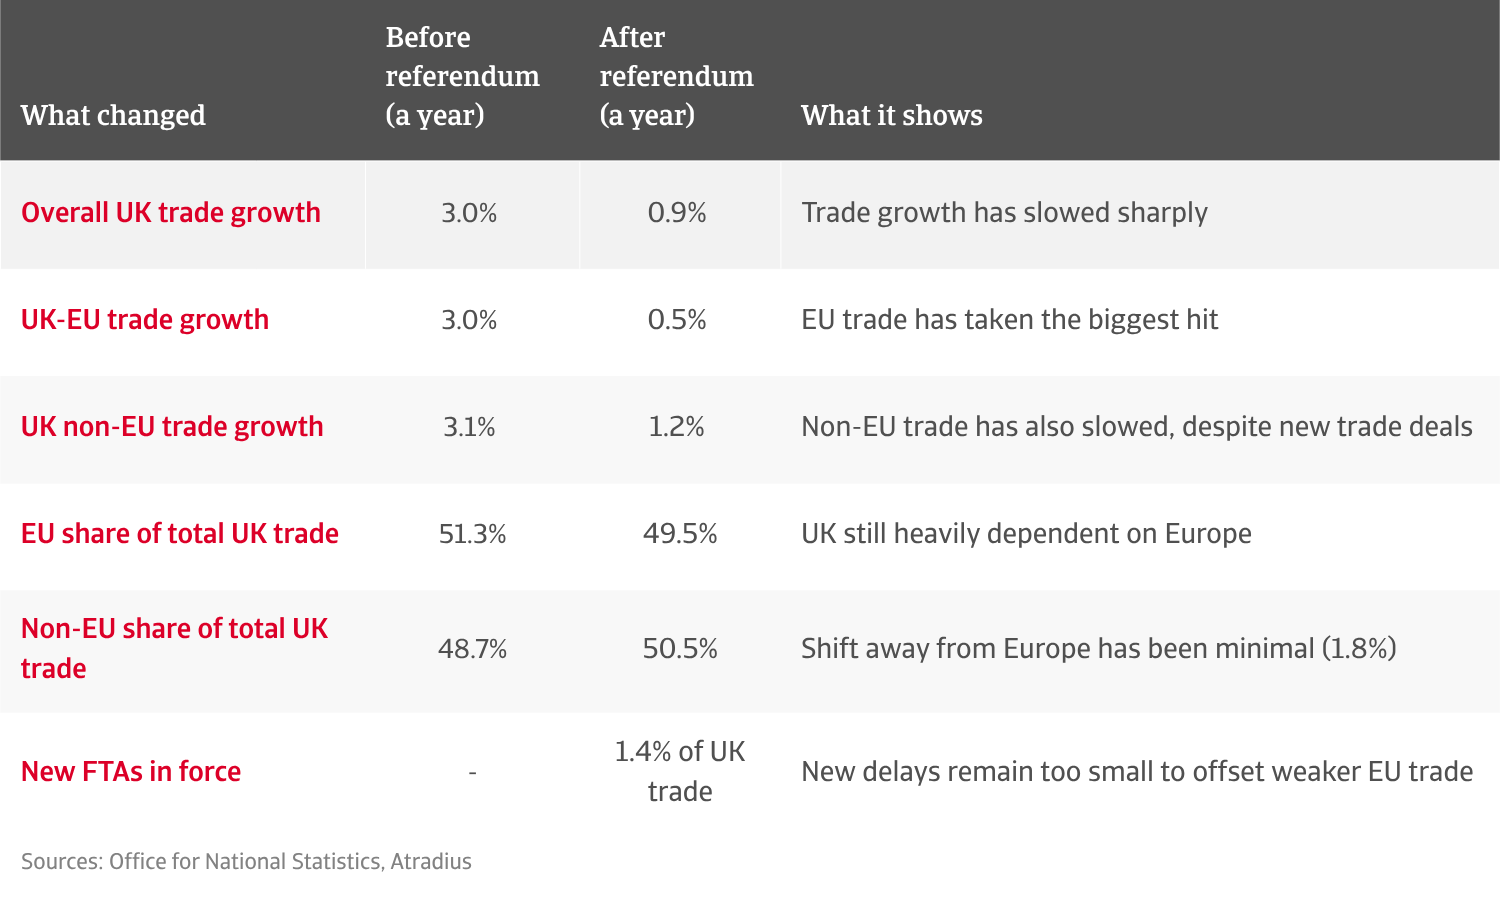
To commemorate this ten-year anniversary, we’ve used official ONS data to track UK trade volumes from before the Brexit vote through to today. The findings are stark: before the 2016 referendum, total UK trade was growing by 3% a year, spread evenly between EU and non-EU markets. Since then, overall trade growth has dropped to 0.9% annually, and growth with the EU has slowed to a trickle at 0.5%, compared with 1.2% for the rest of the world.
It’s also clear that Brexit has failed to deliver the global trade transformation promised by Brexiteers. The UK hasn’t replaced Europe with faster-growing global markets and hasn’t meaningfully reduced its dependence on the single market either. According to the latest data from June 2026, the EU’s share of total UK trade has dropped by only 1.8 percentage points (ppt) in ten years, from 51.3% before the referendum to 49.5%.
.2026-06-29-09-34-08.png)
The headlines often say the UK has over 70 active trade deals, but the vast majority are simply rolled-over versions of what it already possessed as an EU member. The UK has signed a few brand-new agreements, but their benefits are minimal compared to the scale of trade with Europe, accounting for just 1.4%.
UK exports to the EU have actually held their share well, at 47.7% — fractionally higher than 2016, as British companies do their best to hold onto their European customer base. The real structural change has happened on the import side, where the UK’s reliance on EU imports fell by 3.6 points to 50.7%. To dodge the headache of new border controls, British companies have actively shifted where they buy their parts and raw materials, looking outside the EU whenever possible.
The EU remains the single largest market for UK trade, losing only 1.8 ppt of market share since the Brexit referendum. The share of UK exports to the EU has only increased by 0.4% in a decade, but imports from the EU have declined by 3.6 ppt, showing more signs of structural reorientation.
Ten years on, it is clear that brand-new, independent Free Trade Agreements (FTAs) are not moving the macroeconomic needle. The UK-Australia FTA accounts for only 0.8% of total trade, while the UK-New Zealand FTA makes up a minor 0.2%, and joining the CPTPP Pacific Trade Bloc only opened up trade with Malaysia and Brunei, which together add just 0.4%.
The UK has signed more promising global trade deals - with India in July 2025 (1.7% of trade) and with the Gulf Cooperation Council (GCC) in May 2026 (2.7% of trade). These are opportunities for the future, but neither deal is officially active nor in force yet.
With the European market slow and new trade deals offering small returns, many British businesses pinned their hopes on the world's two largest individual markets: the US and China. But since 2024, trade with both superpowers has hit a major roadblock. Total trade volume with the US is up 9% compared to ten years ago, but the post-pandemic momentum has evaporated since 2024, as trade wars and tariffs take their toll. Before Brexit, UK-US trade was growing at a roaring 10.7% a year. Over the last decade, that has cratered to a sluggish 1.5%.
Trade with China followed a similar path, surging right after the 2016 referendum, flattening out in the early 2020s, and contracting sharply since 2024. This is largely due to weaker consumer demand in China and a conscious decision by British businesses to "de-risk" away from Chinese factories. China trade growth has plummeted from 11% each year pre-Brexit to just 3% post-Brexit.
Behind the EU, the UK's largest trade partners are the US (11.6%) and China (8.8%). Trade with these markets have both stalled in recent years and there's been limited evidence of enhanced leverage or growth opportunities for the UK with them bilaterally.
The UK's changing trade relationships with EU countries have not been uniform.

Germany is one of the clearest examples of lost momentum. UK exports to Germany are now 21% below their June 2016 level and still falling (down 4.6% in the past year), while UK imports from Germany have been roughly flat over the decade but are now growing again, up 4.4% in the past year. For B2B companies, Germany is central to advanced manufacturing, machinery, automotive components, chemicals and industrial supply chains. These are sectors where border friction, customs paperwork, rules-of-origin requirements and regulatory divergence can directly affect margins and competitiveness. Brexit didn’t remove Germany as a trading partner, but it has made the relationship harder to manage.

UK exports to the Netherlands have surged by 32% since the referendum, though growth has cooled to 2.7% in the past year. UK imports from the Netherlands are down slightly over the decade (-7.8%) but are now rebounding fast - up 11.4% in the past year. This data looks more positive, but stronger flows in one direction are not necessarily a broad Brexit benefit. It shows that UK exporters are adapting to survive, but at the extra cost of more warehousing, revised distribution routes, more customs support and higher working capital to manage longer or less predictable supply chains.

Danish trade has shown healthy growth over the decade. UK exports to Denmark are up 12% since 2016, while UK imports from Denmark have surged by 49.5%, driven largely by pharmaceuticals, chemicals and fuels. The best UK export sectors are machinery and transport equipment (+16.3%) and food and live animals (+10.8%). This is a genuine positive, but could be more of a sector-driven story rather than a post-Brexit trade dividend. Denmark shows that European trade can still grow where there are strong sectoral drivers to make it work.
Brexit has made the UK economy smaller than it would otherwise have been. The Office for Budget Responsibility estimates that Brexit will reduce long-run productivity by around 4% compared with remaining in the EU. More recent research puts the cost higher, estimating that UK GDP per person is 6% to 8% lower than it would otherwise have been, with investment 12% to 18% lower.
Success in 2026 requires a new playbook to combat structural friction. For physical goods companies, the just-in-time supply model no longer works for European markets. Many UK manufacturers have set up distribution hubs inside the EU to hold inventory closer to their European customers. The UK's trade level index with the Netherlands shows imports from the UK sitting at 132.2 (2016=100), as firms use it as a gateway, while the trade level index with Germany fell to 78.8 as more UK firms near-source materials to avoid border costs.
Brexit has added customs declarations, rules-of-origin requirements, regulatory checks, VAT complications and new compliance costs. It has dramatically cut UK trade growth, yet failed to meaningfully reduce the UK’s dependence on the EU or produce a global trade dividend. B2B companies have had to adapt to a new reality of squeezed margins, more complex supply chains and higher working-capital needs, which makes credit risk management and robust payment terms more important than at any point since the referendum.
To explore how to strengthen your own credit risk strategy, get in touch with us and see how we can help you stay ahead.
